To create a new diagram, navigate to the Documentation tree. First, select the Diagram heading in the tree view, then create a new folder by clicking the New button above the tree and then you can create a new diagram. Specify a name for the folder and the diagram. Now you can create a diagram on the Diagrams tab.
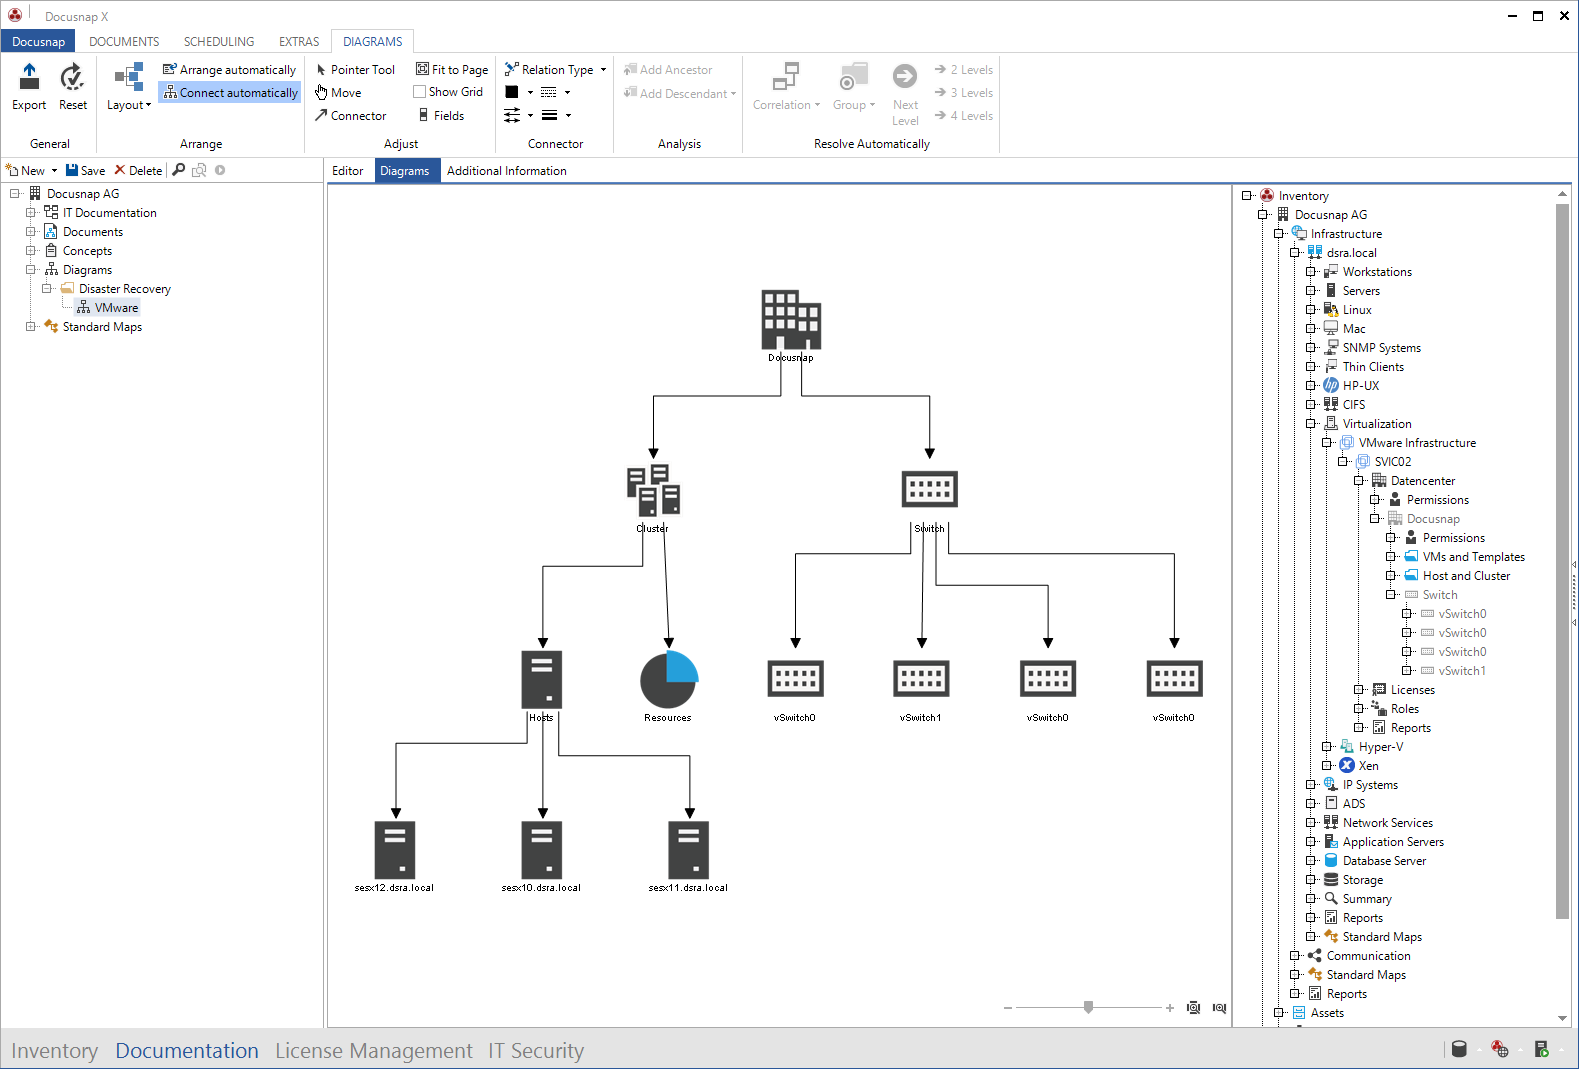
The right pane shows the Inventory tree. It contains the data from the most recent network inventories.
Select a component and drag it to the Diagrams tab while holding down the left mouse button.
|
The preview icon (100x100 px) of the respective object is used as the icon. If objects are created via customizing, it is recommended to also use icons with the size 100x100 px, so that all icons have a uniform size. |

Ribbon
The Diagrams ribbon allows you to define additional settings for creating the diagrams.
Use the New, Save and Delete buttons above the tree view to create or delete new diagram or save changes made to existing diagrams.
General: You can export the current diagram to a Visio file by clicking the Export button. Clicking the Reset button will load the last saved version of the diagram again.
Arrange: Use the Arrange group on the ribbon to select an algorithm for automatic arrangement of the objects.
With the Connect automatically button enabled, each new component will be connected to the most recently selected component.
Adjust: The Pointer Tool allows you to select individual components by a mouse click.
To move the entire diagram, click the Move button.
If the Connector button has been selected, you can create a Connector using the mouse. Click a component and drag the mouse (while holding down the mouse button) to the second component. This will connect the two components.
Clicking the Fit to Page button resizes the diagram so that it fits the page.
Connector: The desired type and design for a connector can be selected from the Connector group.
Analyse: Use the Add Ancestor and Add Descendant to add the hierarchical ancestor and descendants of the selected object.
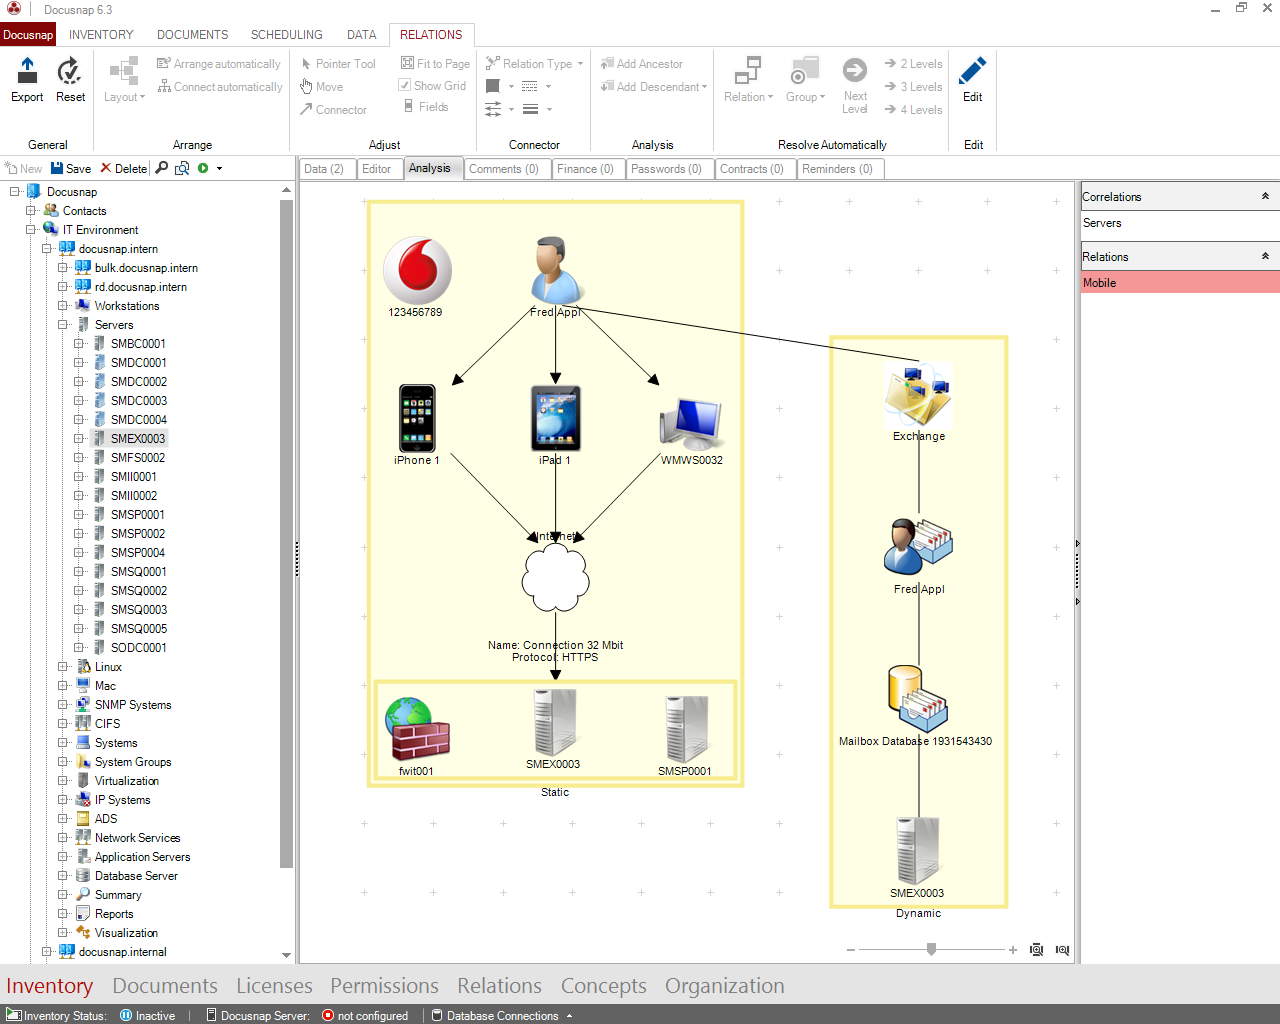
Resolve Automatically: By clicking the Diagram button you can add the IT Correlations of the selected object.
By clicking the Group button you can add groups of IT Correlations of the selected object.
By clicking the Next Level button or the 2 - 4 Levels button you can choose how many levels of the IT Correlations should be added.
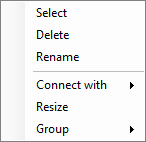
Context Menu
A context menu is available when you right-click the components and connectors.
This menu contains options to delete the current object or to connect it with other objects. When selecting multiple objects, you can align them horizontally or vertically or set them to the same height or width. Additionally IT Correlations, ancestors and descendants can be added.
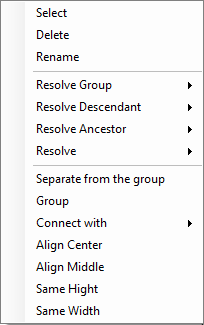
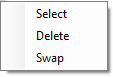
The connectors can be deleted from the context menu. What is more, you can swap the starting and ending points or select a different starting or ending point.
Using the context menu options, it is also possible to rearrange groups or resize them.
Properties
Once a connector has been selected, the Properties entry screen appears. Here, you can specify additional information about the selected connector. The properties will be displayed along with the connectors. You can select the properties to be displayed from the Fields dialog. Optionally, you can add to the properties by editing the tRelLink table. Adding columns to the databases and entry screens is described in the Configuration Manual.
IT Correlations
When creating the relations objects of IT Correlations can also be added. Unlike Diagrams which represent the relationship between two given objects, the IT Correlations are defined between two types of objects. The context menu of the added objects lists under Resolve Relation entry all IT Correlations and by clicking on it the desired one can be resolved. IT Correlations can also be added by clicking the Relation button in the ribbon. Groups can also be added via the context menu and the ribbon.
Additionally the hierarchical ancestors and descendants can be added via the context menu. Click on the entry Resolve to select how many levels of IT Correlations should be resolved.
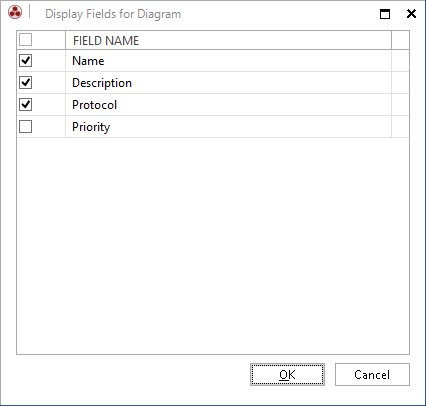
Fields
Each connection has properties, such as a name, a description, a priority, etc. that you can select for display in the diagram. Click the Fields button in the Diagrams ribbon to open the dialog. For each diagram, you can select the fields to be displayed from the Display Fields for Diagram dialog.
Deleted entries
If objects are deleted that have already been inserted into a diagram, they are not deleted from the diagram, but marked with (deleted).
|
Some objects can be moved in the data explorer. For example, systems that are moved to another domain, systems that are changed from offline host to Windows systems, or IT assets that are placed in a different folder. By moving the object, it can no longer be linked with the diagram. Therefore, it will be marked as (deleted). In this case, the object would have to be deleted from the diagram and then added to the diagram again from the new position in the tree. |
Opening relations from other tree views
The Analysis tab is displayed for each object you select in the Data Explorer. If the selected object is used in a diagram, that diagram will be displayed on this tab. In the Analysis tab the diagram can be exported. To edit the diagram click the Edit button to open it in the Diagrams tab.